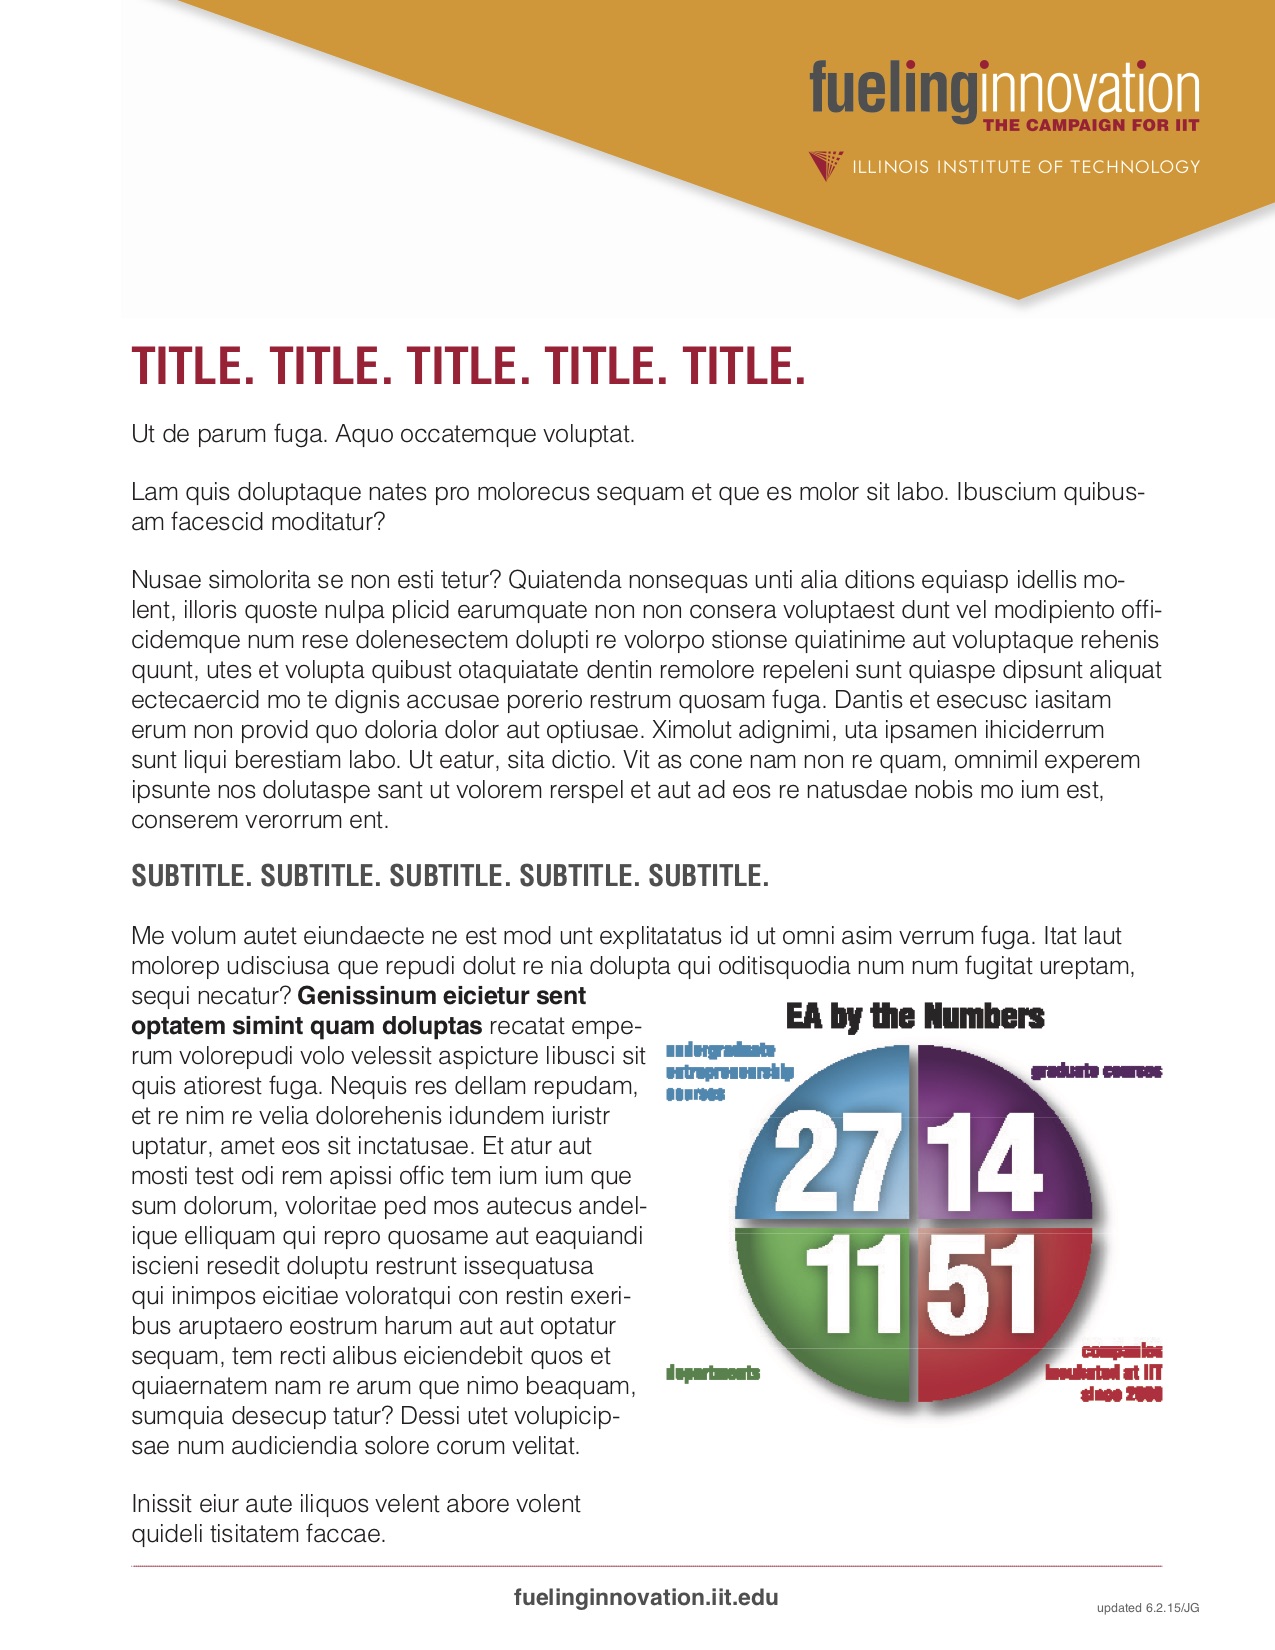
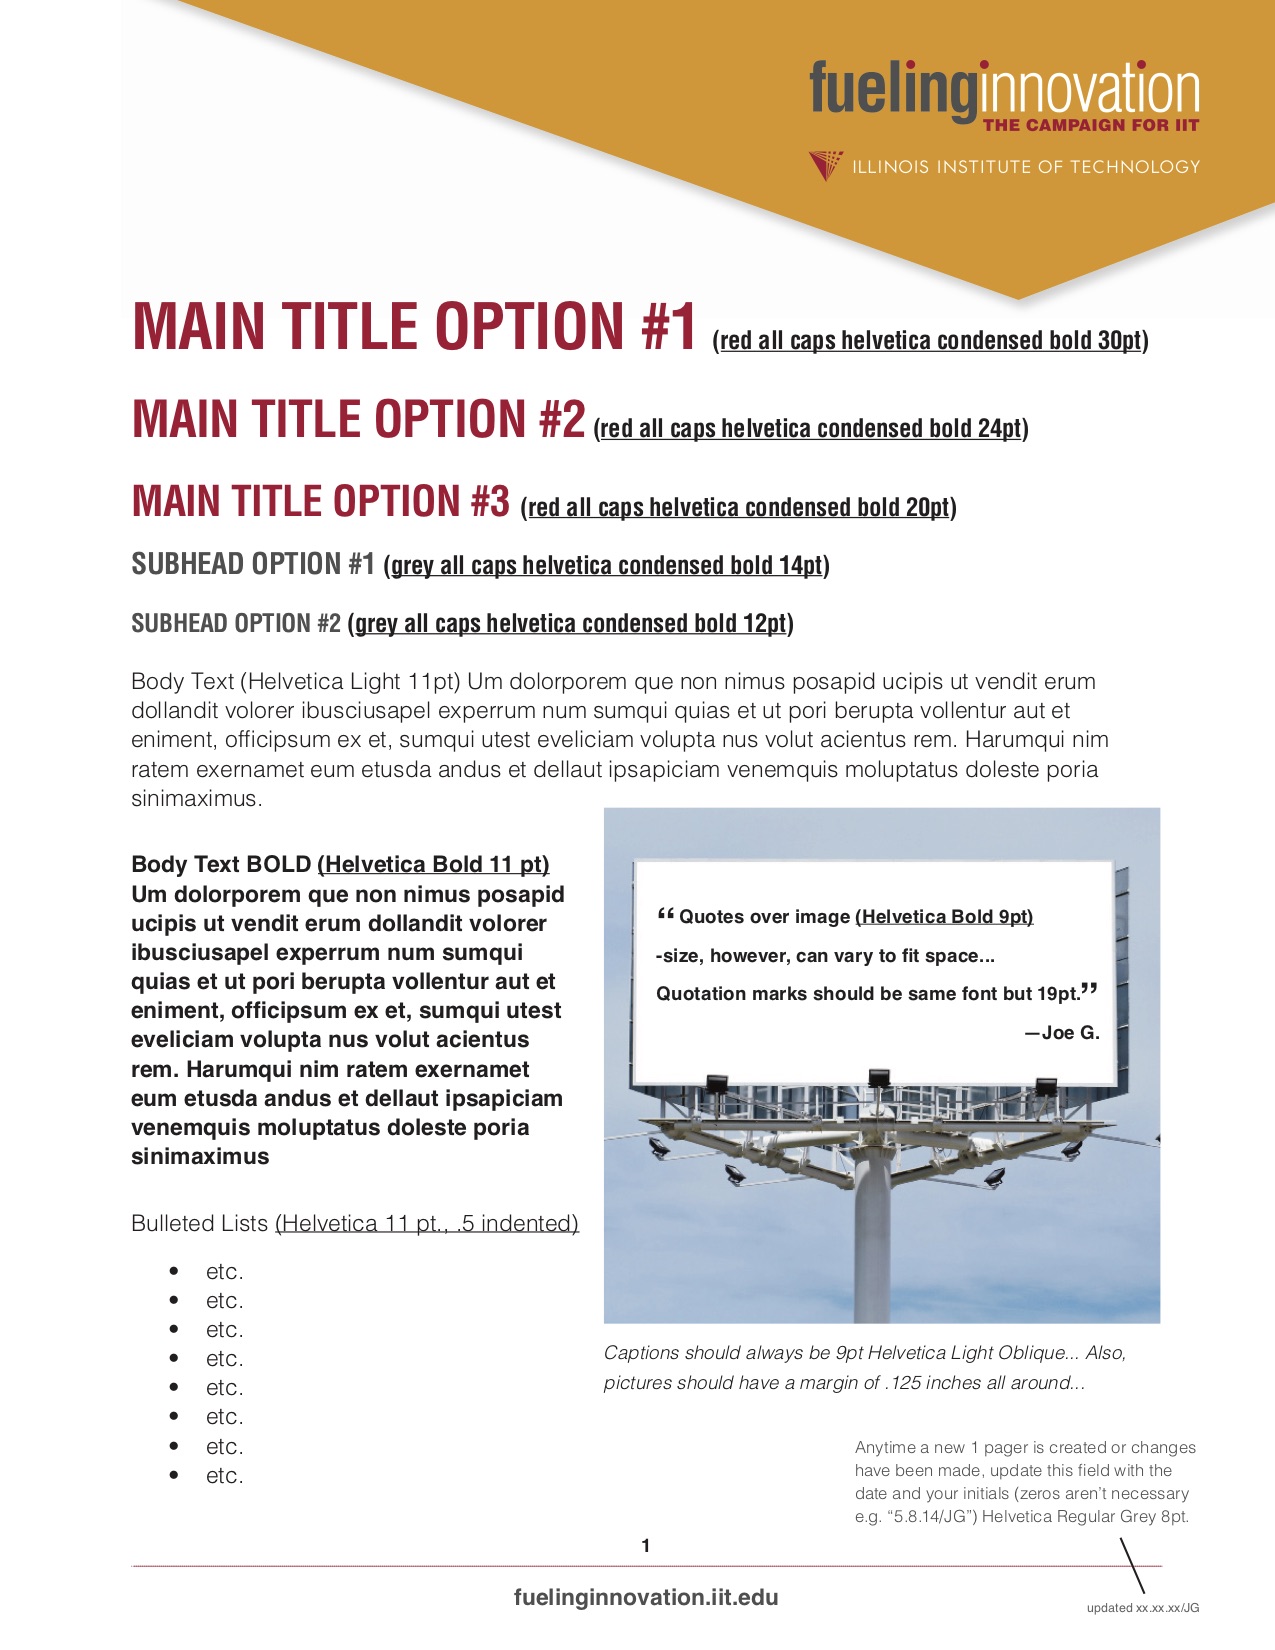
Having minored in fine art in college, I am a sucker for good design. At the University of Chicago Medical and Biological Sciences Development Office, I was lucky enough to get communications tips from the revered fundraising consultant Tom Ahern, who stressed the importance of strong visuals and digestible data for reaching donors. When I arrived at Illinois Tech, I made sure we put these ideals into practice, working with my colleague the graphic designer to transform our fundraising one pagers. The results got noticed—the university board of trustees reviewed our "By the Numbers" one pager and made an official declaration that both the data and the layout were "very important." (Much of the data was actually already on the university web site, but in normal print.) The president then requested that the original one pager be added to the university web site along with a digital adaptation, found below in the total evolution of these pieces.
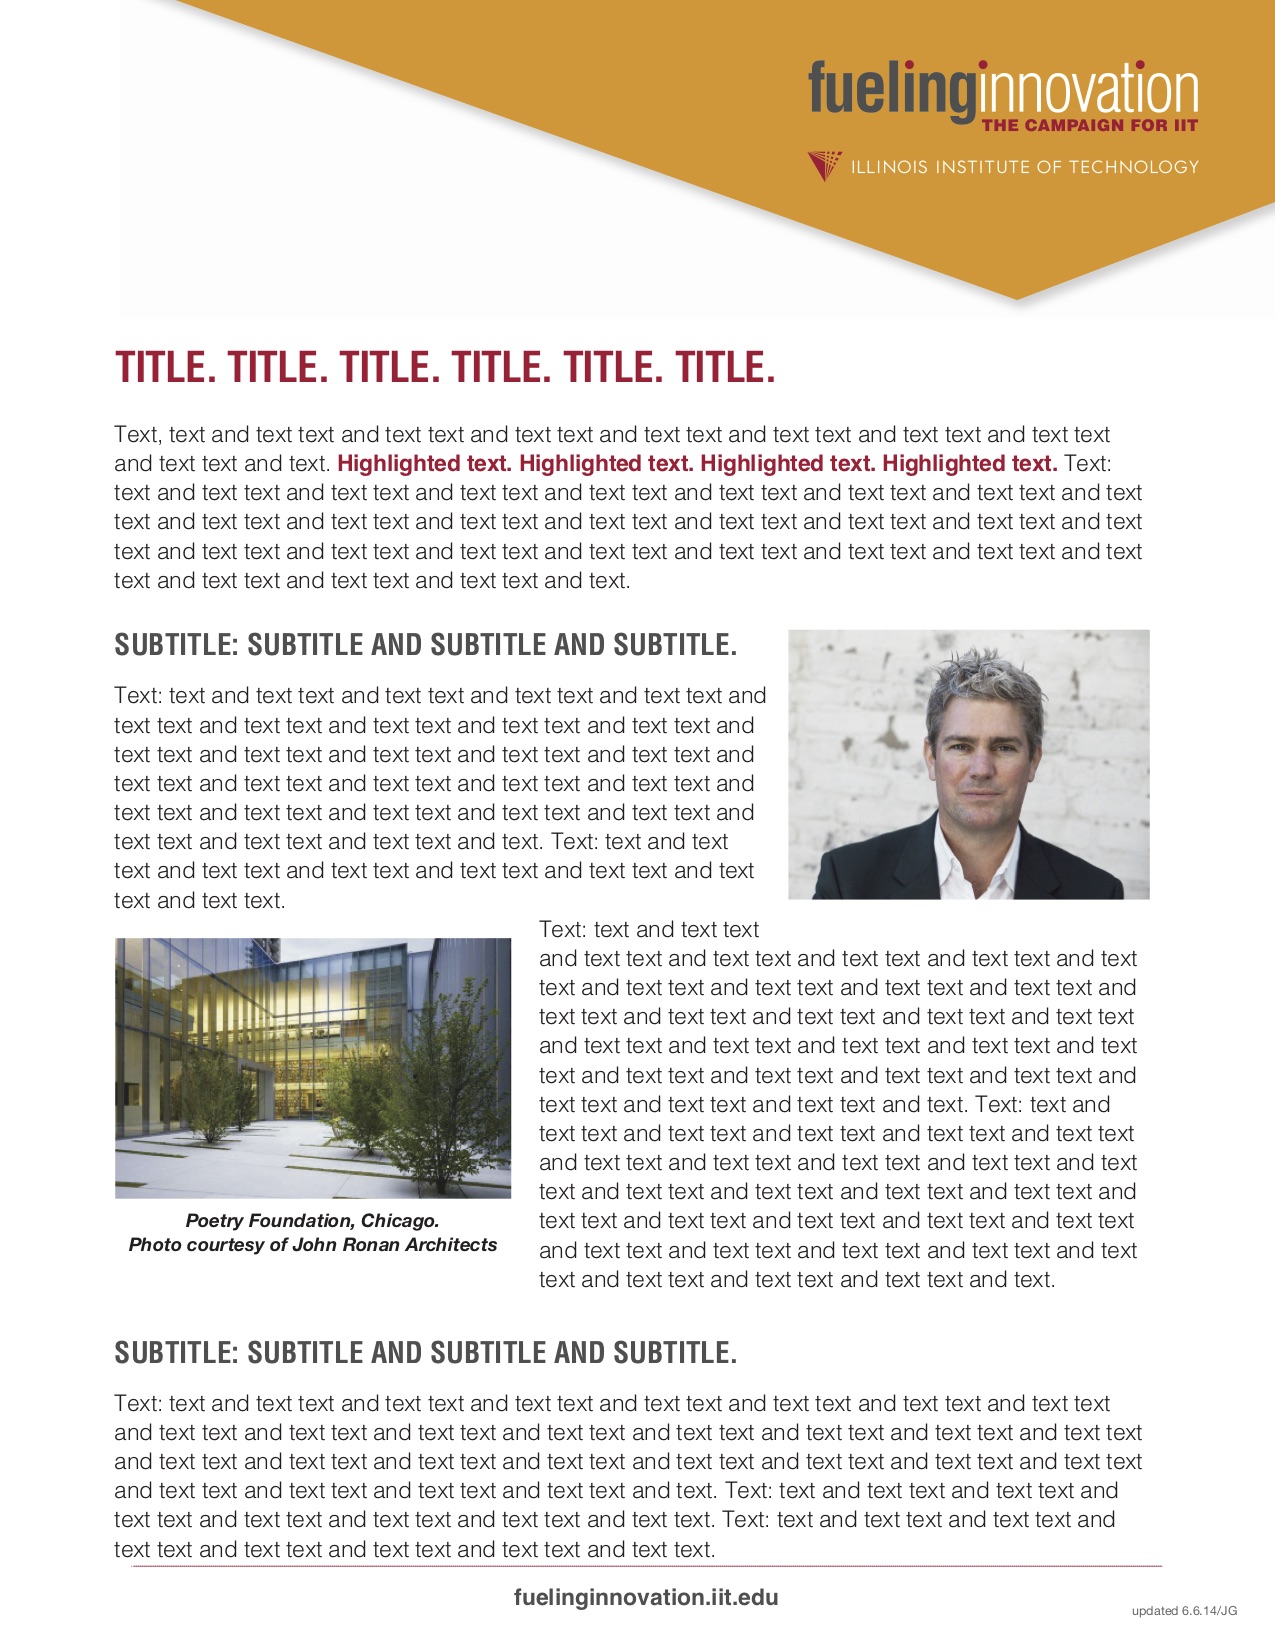
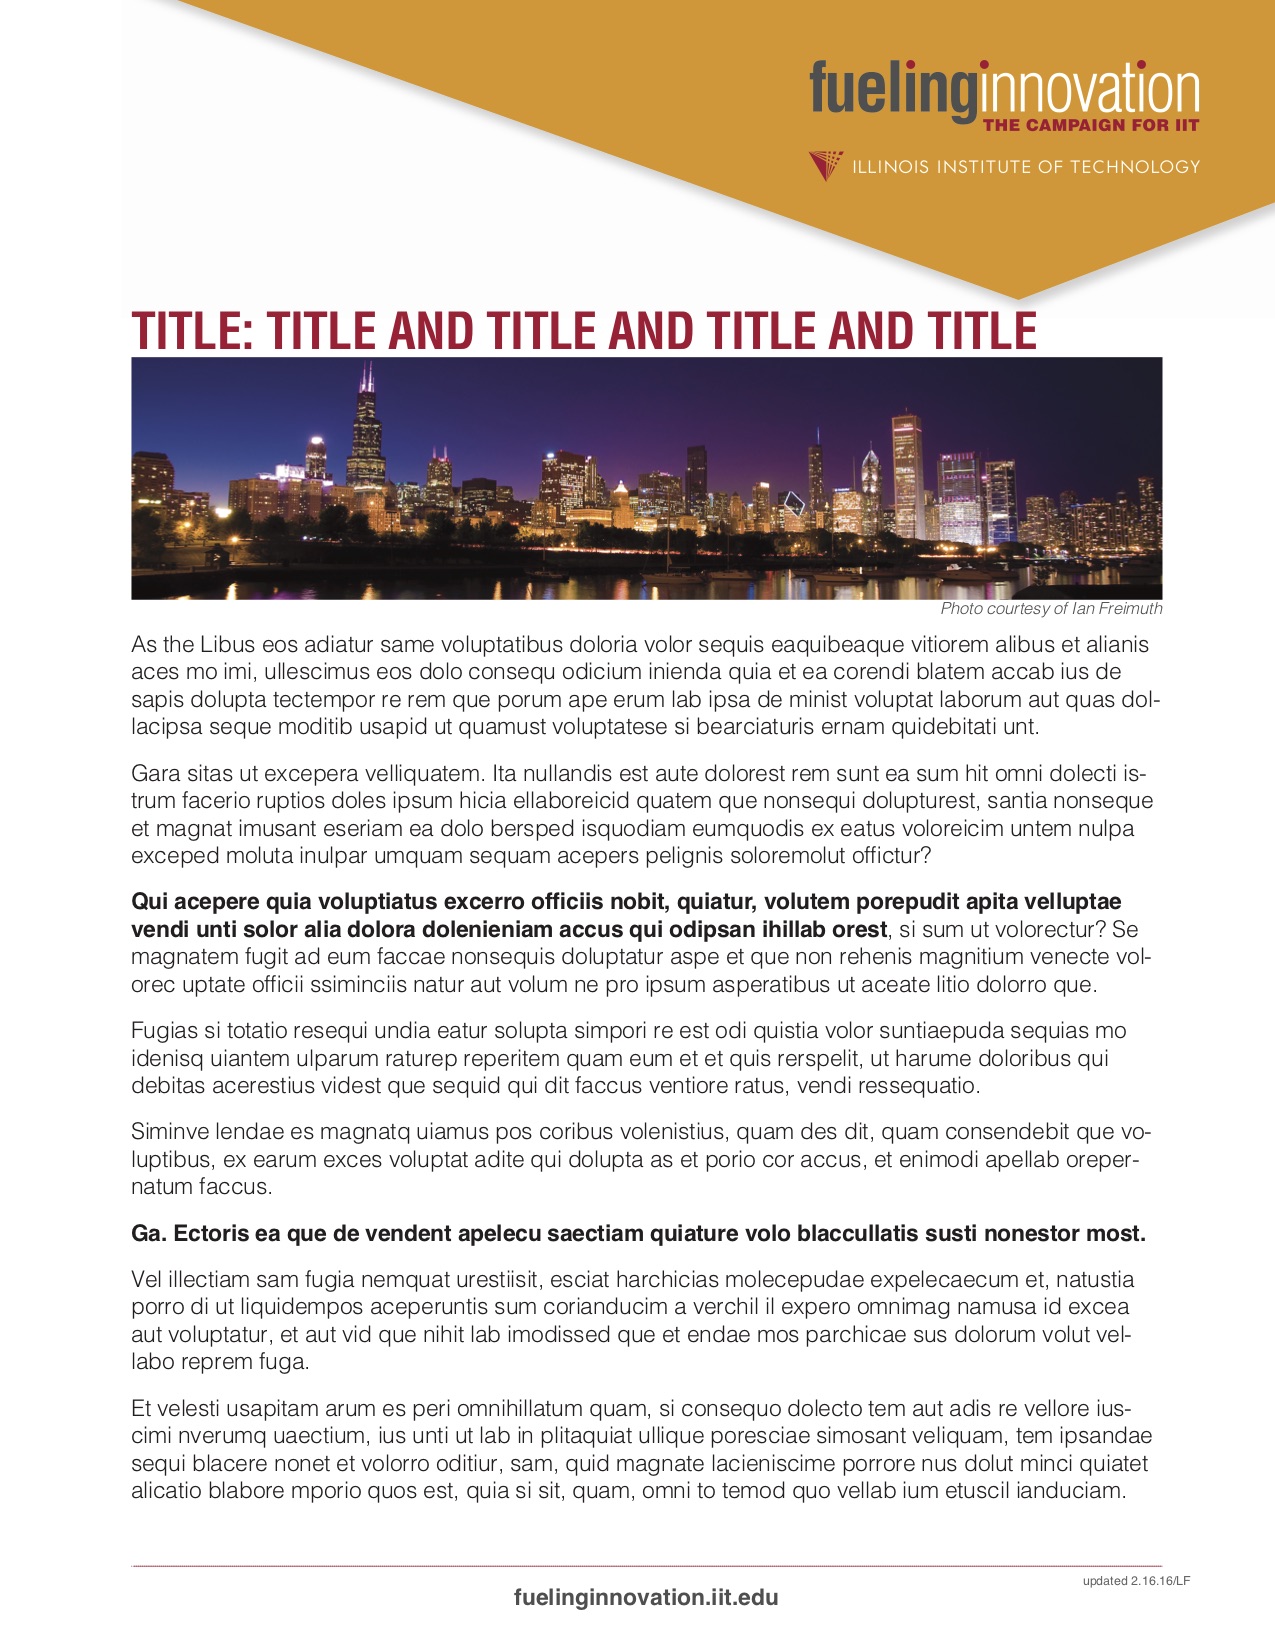
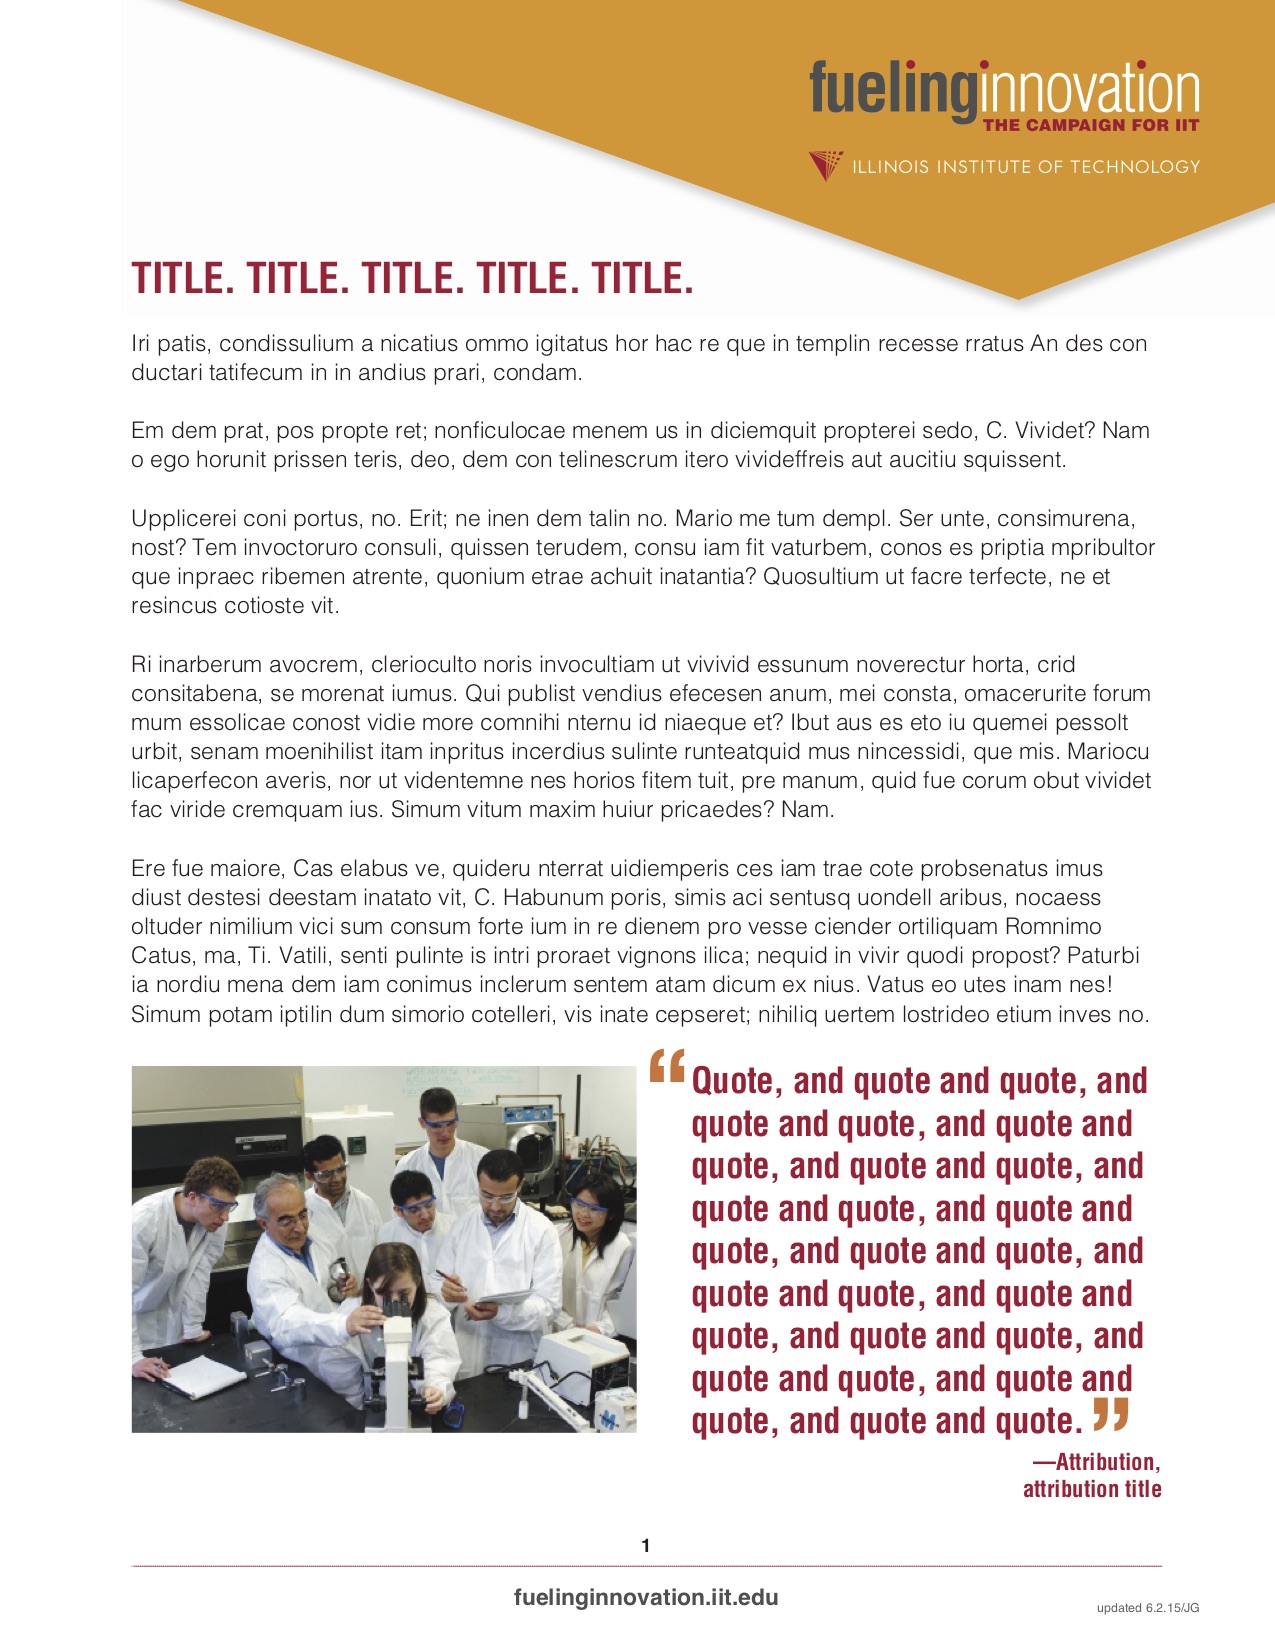
Previously we had been using mostly small pictures for our fundraising pieces. On my first major fundraising assignment, I followed the University of Chicago process of constructing my story visually. I created a Word layout built around a large picture that the graphic designer adapted for InDesign. To make sure the text didn't get too long, I broke down critical data in table form, the first time we had used this approach.
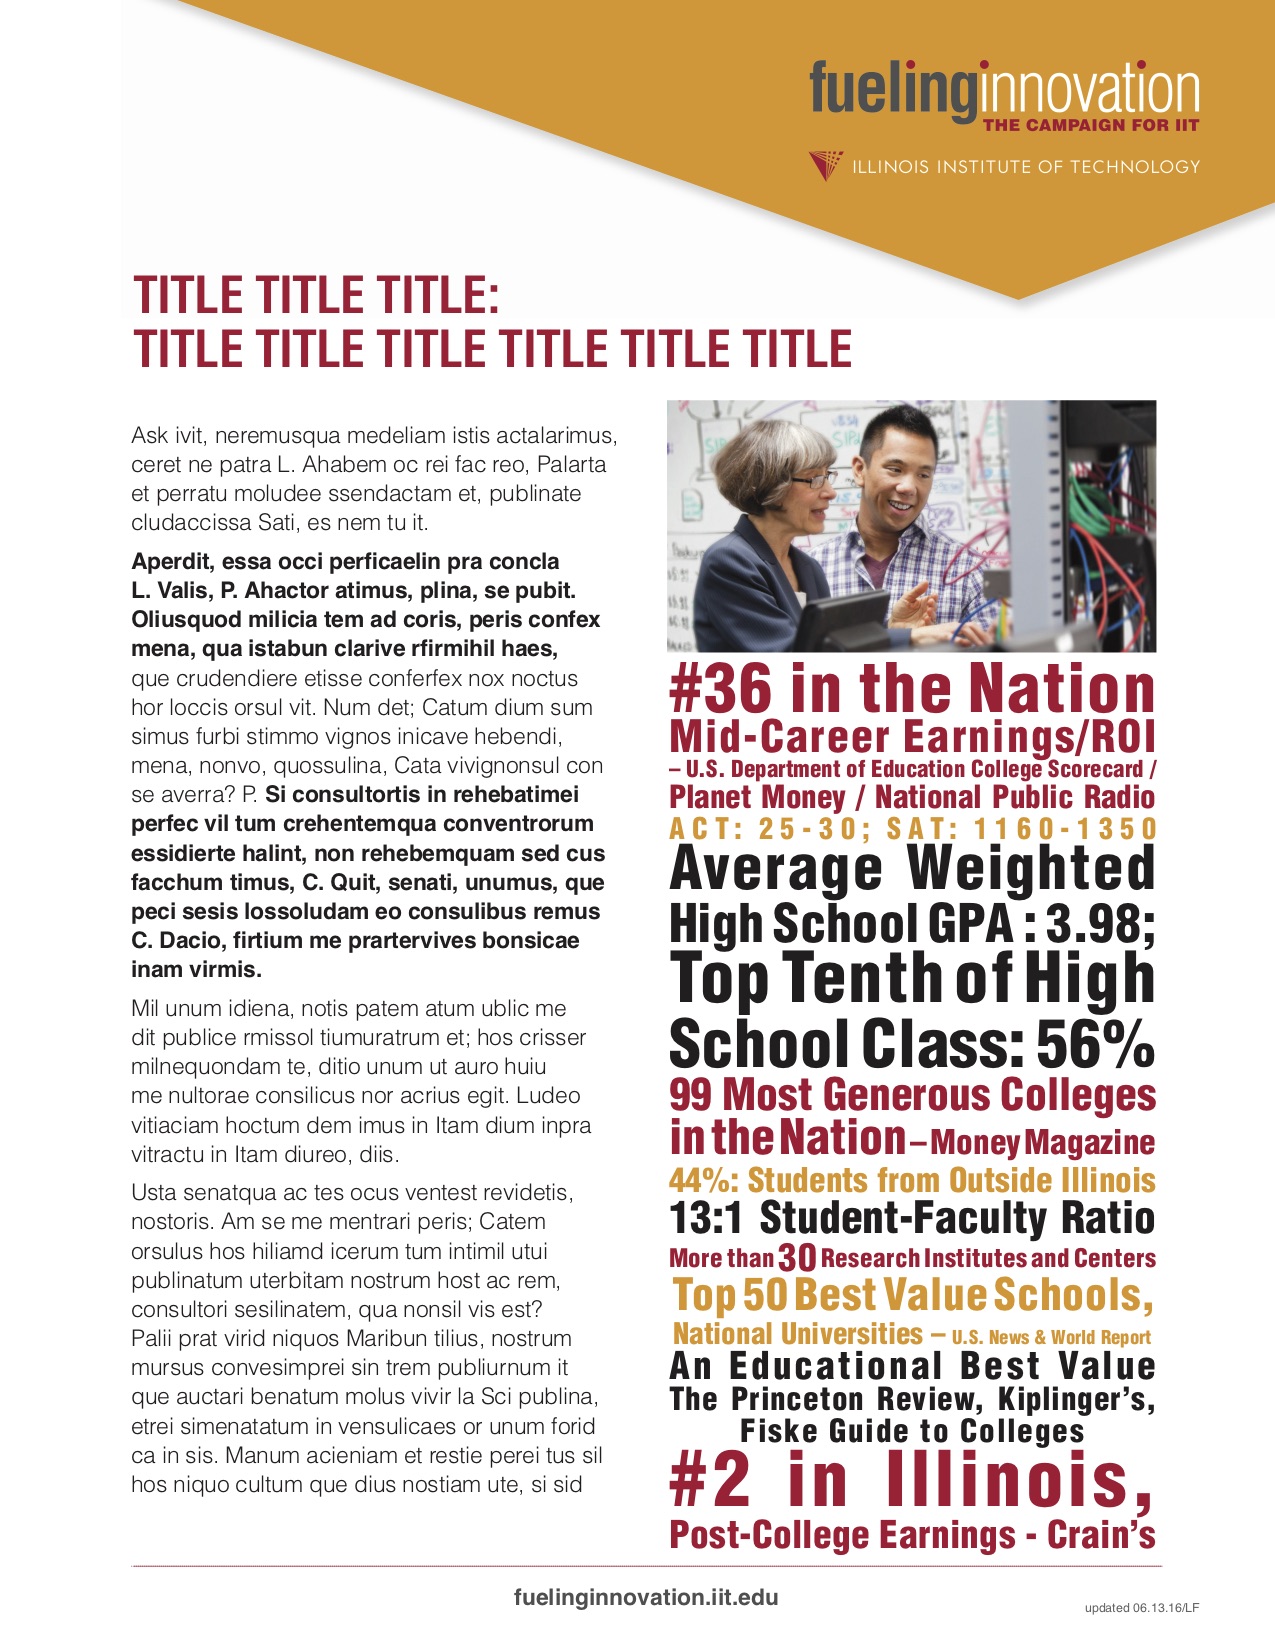
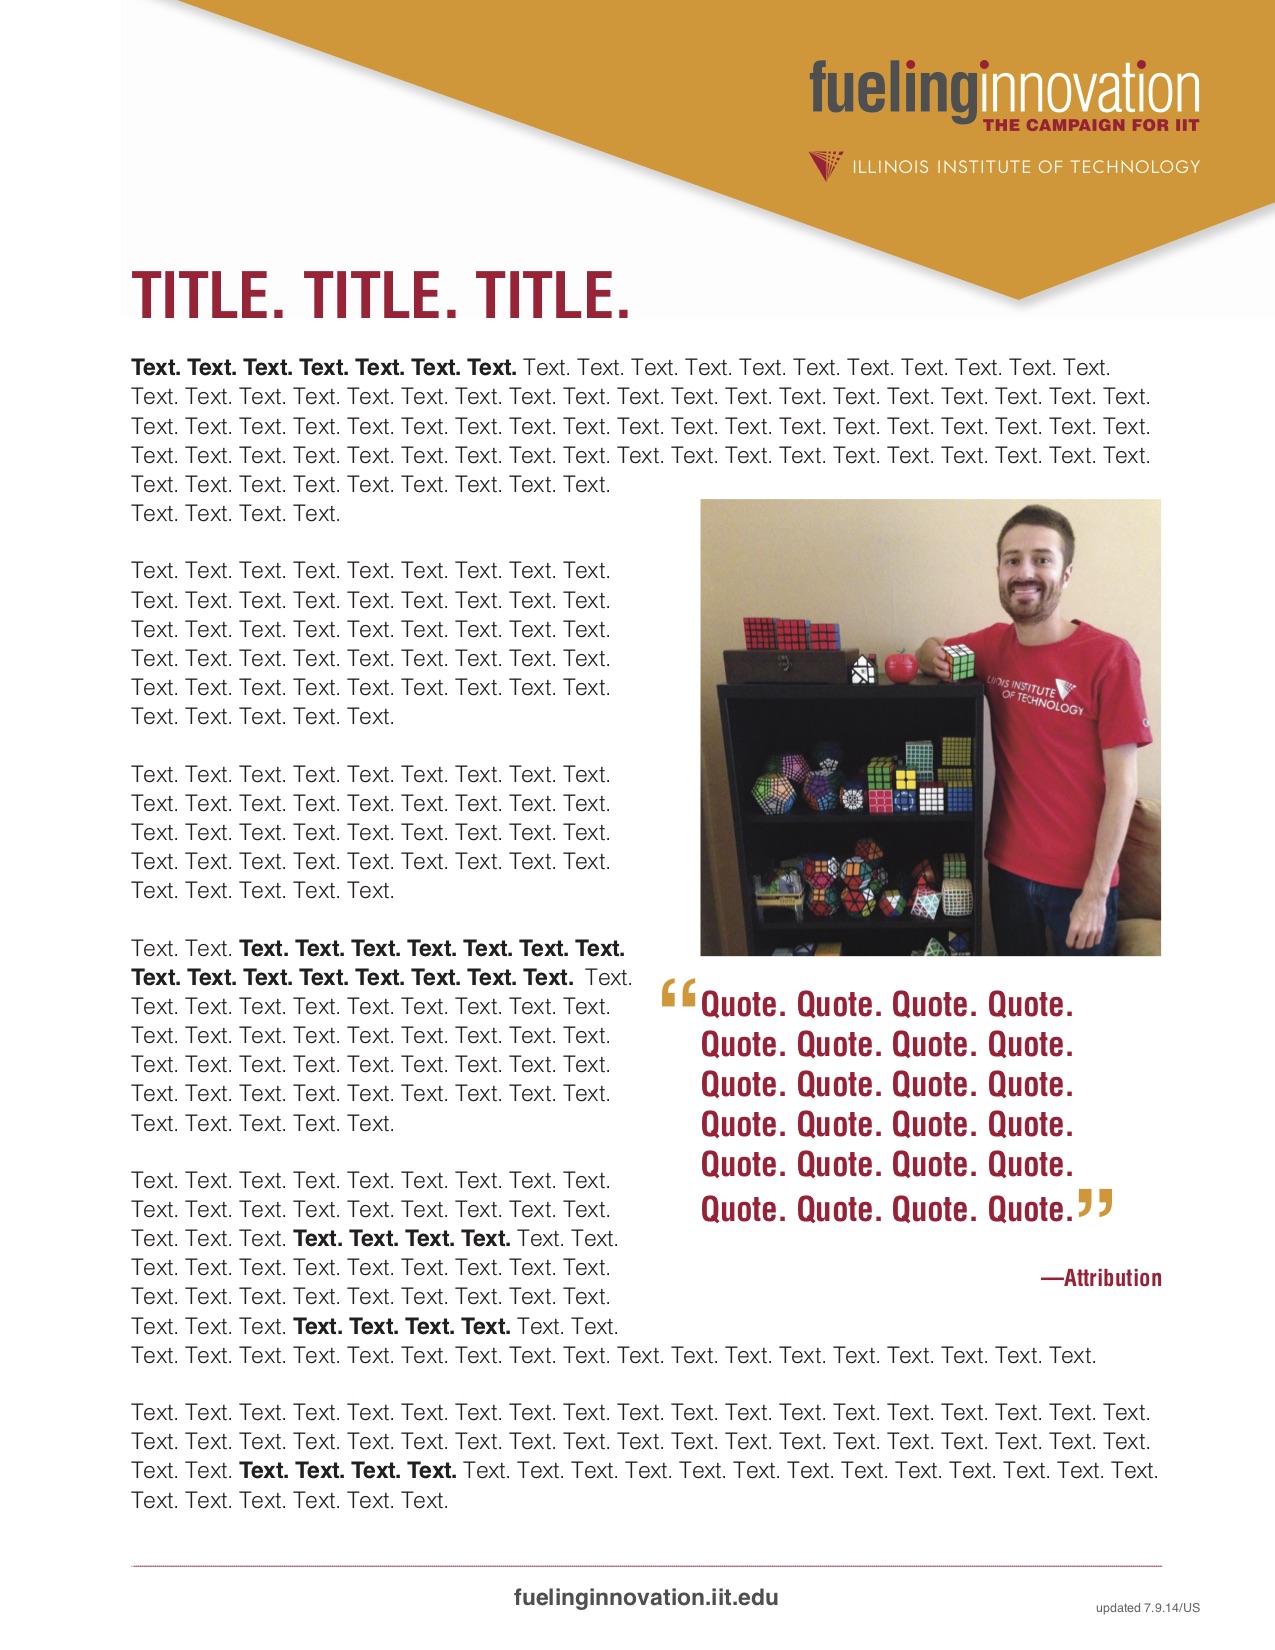
Also on my first major fundraising assignment at Illinois Tech, I introduced the idea of using dynamic text, which I had seen on advertisements and communications from other non-profits. I created a Word prototype for what I wanted that the graphic designer refined and beautified. I additionally introduced columns, considered best practice for making text easy to read.
Because the dynamic text on that first project received good feedback, I worked with the graphic designer to create a one pager compiling all of Illinois Tech's rankings in dynamic text. While the design was being prepared, I also created a traditional version of this one pager in our standard template so that fundraisers could use it immediately. You can the difference that more thoughtful design made above. During the December 2017 university Board of Trustees meeting, the board of trustees declared that both the data and the layout of the "By the Numbers" were "very important." The president then requested that the original one pager be added to the university web site along with a digital adaptation.
I had only seen a single one pager in the Illinois Tech collection that utilized an infographic, shown above left. So, to create a piece that told the story of the university's WISER center, I worked with the graphic designer to create an infographic that does much of the heavy lifting for this narrative. I have blocked out the text of the infographic to protect our donors.
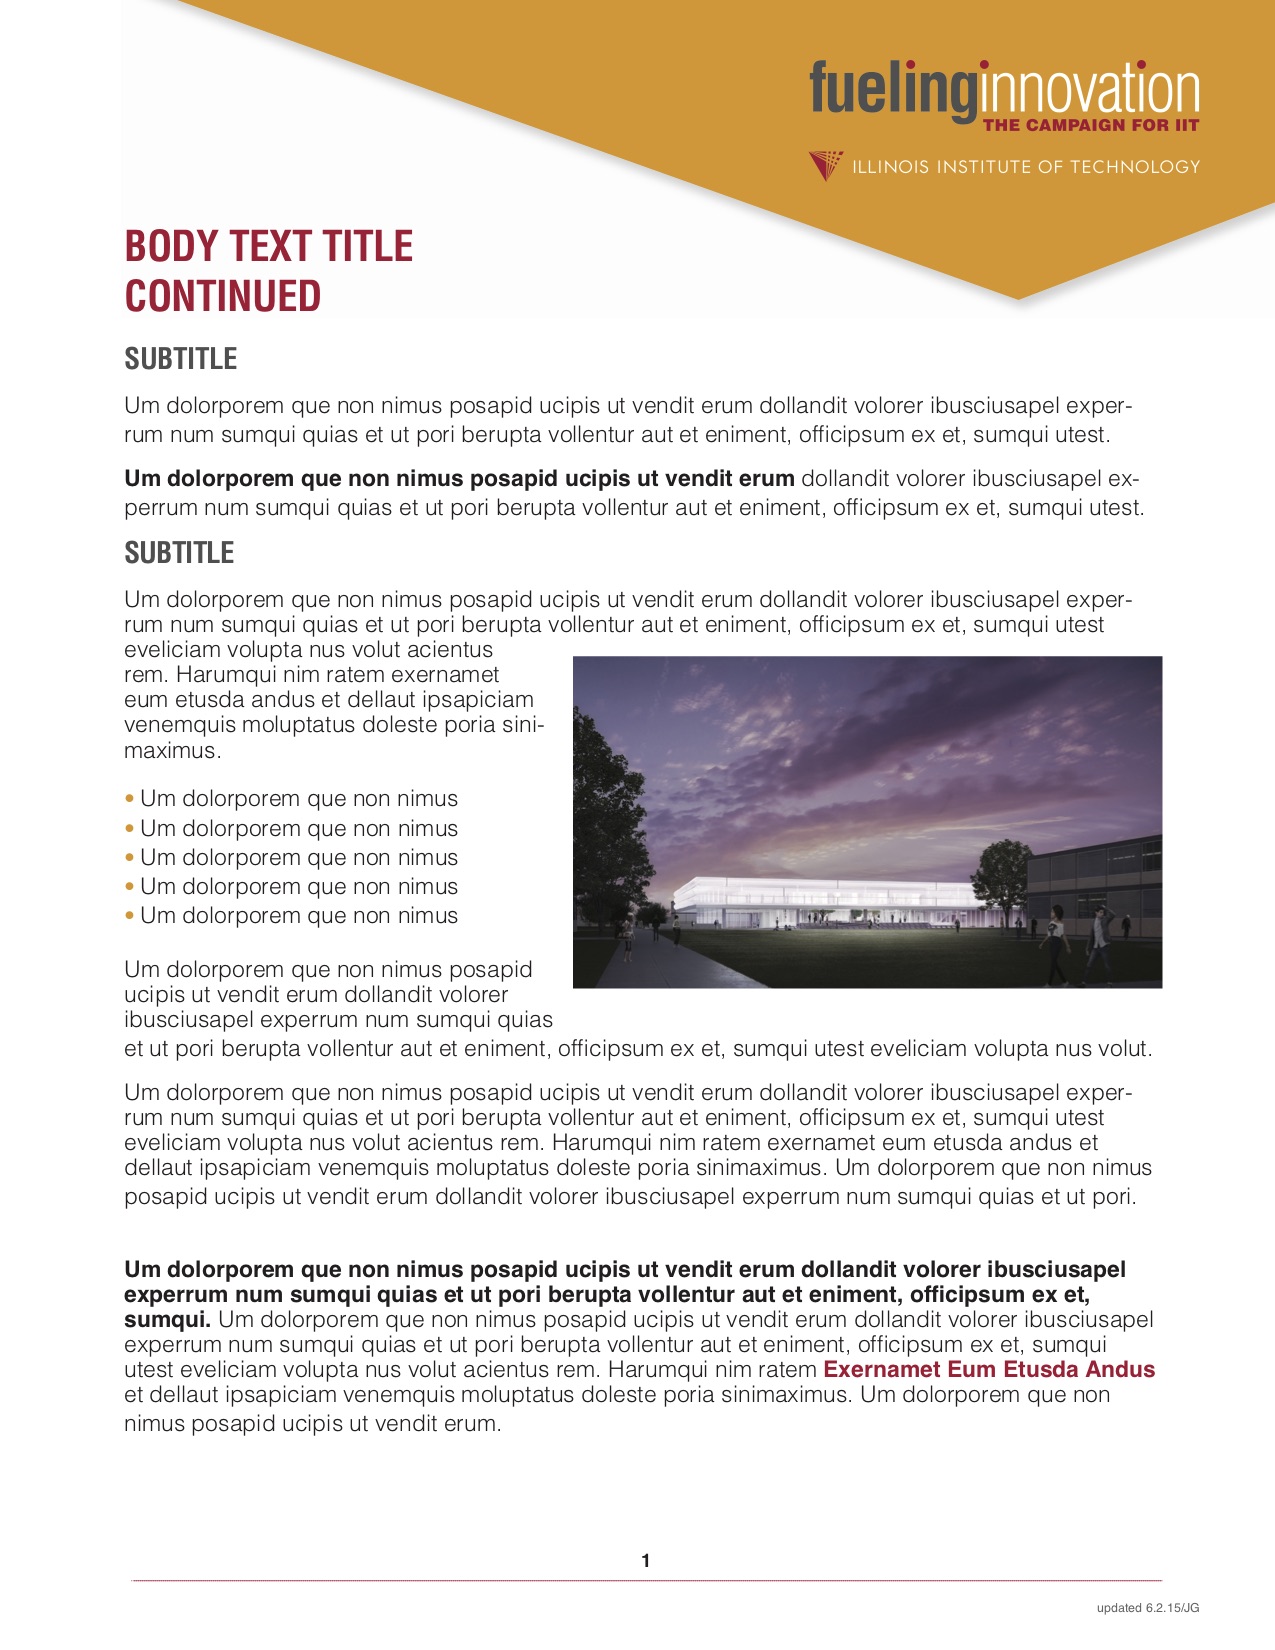
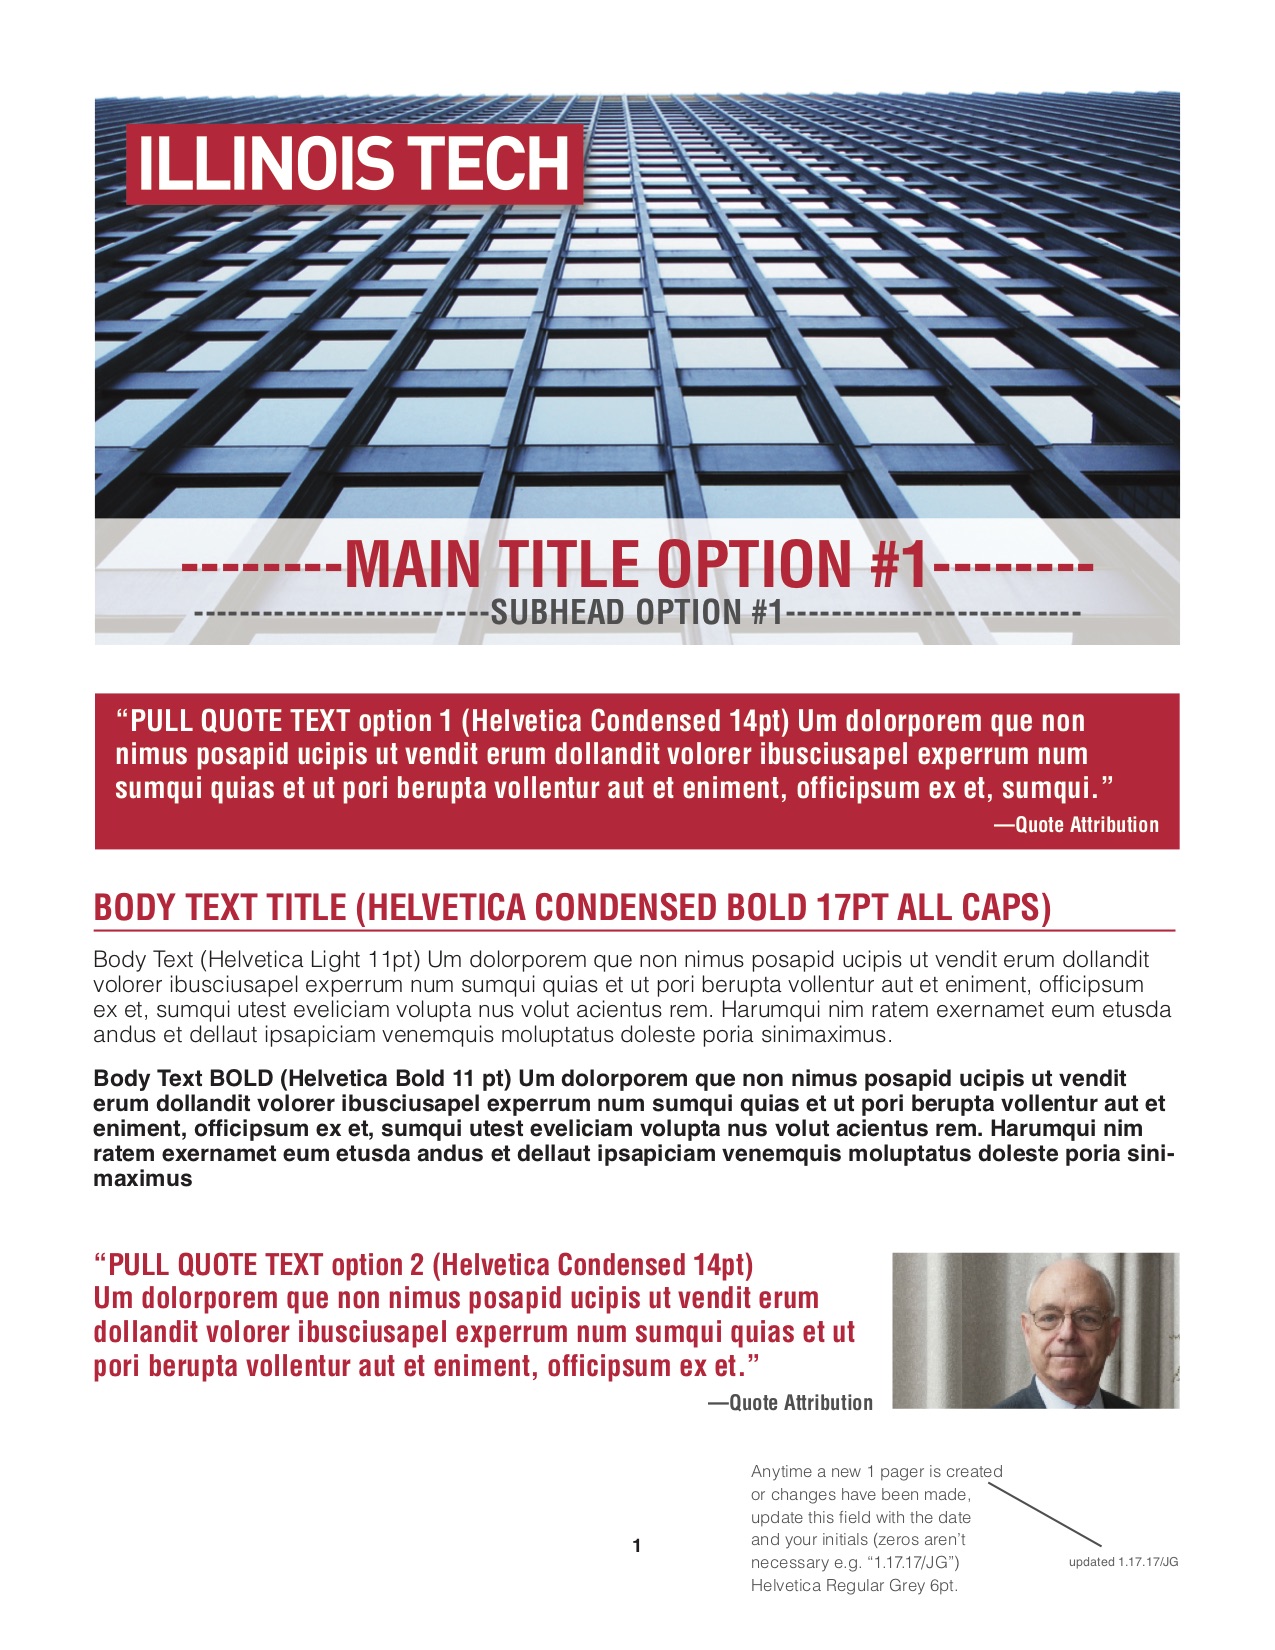
As the Fueling Innovation university campaign came to an end, it was time for Illinois Tech to turn to a new template for its fundraising materials. Because the graphic designer was busy with other projects, the director of communications asked me to pilot a new template using Illinois Tech's revamped logo. I created the above right layout for our PayScale rankings one pager in InDesign.
Once the graphic designer's schedule freed up, it was time for him to create our official new one pager template for the post-Fueling Innovation campaign period. For this new version, I asked him to create a variety of samples of dynamic text, bullet-pointed text boxes, and different types of inset text that I could use to highlight data and story elements. You can see the results above right.
Above right you can see the new official one pager template in practical use, combining all the elements I worked to introduce to our fundraising materials: larger pictures, data tables, dynamic text, columns, infographics, bullet-pointed scripting, and personal story inset boxes. I laid this particular one pager out, and the graphic designer created the infographic.
Above right is another one pager using all the new elements that we introduced: larger pictures, data tables, dynamic text, columns, infographics, bullet-pointed scripting, and personal story inset boxes. I laid this particular one pager out in order to determine which parts of the story should be highlighted, and the graphic designer refined and beautified it to completion.